Got this web application that I am going to deploy to production next week, I run through its functionality on different browser, to ensure the its function and look & feel wont break up. Found out that there are minor different in each browser like the function getElementByID(), Mozilla wont recognized if we just provide the properties "name" of the object we should used "id" too, and its likely kind of redundant thing but what else I can do, have no choice i dont know what browser may the user prefer to used with. Also found out that the in Safari the muti-box can be expand and shrink its default size just by dragging its lower right portion of the box, and its seems like the whole page will then deform. though its a cool functionality but it can deform the elements of the page. Anyway the web apps is pretty stable on MS Internet Explorer.
Thanks to Firebug plug-in from mozilla and Microsoft Debugger Debugger it can really ease for finding objects and elements on the page. I like firebug feature of its mouse over feature on the script and the elements on the pages will then get highlighted, this is a good visual debugger. On Safari on the other hand, there is no plug-in or add-on that you can download and incorporate, there is one somethimes they called the logger that you are going to run on Mac OS terminal and that if you are using mac. Enabling debugger on Safari is a bit tricky, and I think the trick also differ on each versions. I am using version 3.1.2(525.21) on windows XP SP2. below is the step to enabled it.
Enabling Safari 3.1.2 on(525.21) debugger on Windows XP
1. goto your document and setting profile. like below directory, take note the {username} you must replace that in your own default username.
C:\Documents and Settings\{username}\Application Data\Apple Computer\Safari\Preferences
2. Open the file "com.apple.Safari.plist" on your favorite editor.
3. The file is content is written on XML. The file is the configuration of the Safari itself.
4. add the script below at the bottom of the script,
just before or above the closing tag "</dict>"
<key>IncludeDebugMenu</key>
<true/>
5. Save the file and restart the Safari browser.
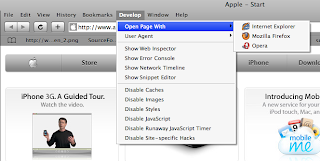
6. Inspect the Safari menu you will now see the menu name Develope.
And of course I am using the Netbeans IDE 6.5 development version, its new feature plugin /addons for browser on mozilla and IE7 called Netbeans Javascript Debugger really help a lot. I hope there will be also soon on Safari and Opera. I have also a tool that one of my colleague on netcat gave me called dbmon.exe, it traces the browser engine footprints, what its currently doing.
So end up my day with a cool browser engine handling war conflict. heheheh. its fun then.
Thanks to Firebug plug-in from mozilla and Microsoft Debugger Debugger it can really ease for finding objects and elements on the page. I like firebug feature of its mouse over feature on the script and the elements on the pages will then get highlighted, this is a good visual debugger. On Safari on the other hand, there is no plug-in or add-on that you can download and incorporate, there is one somethimes they called the logger that you are going to run on Mac OS terminal and that if you are using mac. Enabling debugger on Safari is a bit tricky, and I think the trick also differ on each versions. I am using version 3.1.2(525.21) on windows XP SP2. below is the step to enabled it.
Enabling Safari 3.1.2 on(525.21) debugger on Windows XP
1. goto your document and setting profile. like below directory, take note the {username} you must replace that in your own default username.
C:\Documents and Settings\{username}\Application Data\Apple Computer\Safari\Preferences
2. Open the file "com.apple.Safari.plist" on your favorite editor.
3. The file is content is written on XML. The file is the configuration of the Safari itself.
4. add the script below at the bottom of the script,
just before or above the closing tag "</dict>"
<key>IncludeDebugMenu</key>
<true/>
5. Save the file and restart the Safari browser.
6. Inspect the Safari menu you will now see the menu name Develope.

7. Done. pretty tricky right.
And of course I am using the Netbeans IDE 6.5 development version, its new feature plugin /addons for browser on mozilla and IE7 called Netbeans Javascript Debugger really help a lot. I hope there will be also soon on Safari and Opera. I have also a tool that one of my colleague on netcat gave me called dbmon.exe, it traces the browser engine footprints, what its currently doing.
So end up my day with a cool browser engine handling war conflict. heheheh. its fun then.
No comments:
Post a Comment